





Chainlink price has gained about 4.3% over the past week to trade near $8.50, with LINK now testing the upper end of its recent range after Standard Chartered reportedly set a $200 price target for 2030.
Market reports published on August 10 said Standard Chartered expects Chainlink to reach $200 by the end of 2030, citing its potential role in institutional tokenization.
The bank based much of its bullish case on Chainlink’s potential role in the tokenization of financial assets, where its infrastructure can connect blockchains with external data and allow assets to move between different networks.
LINK traded around $8.50 on August 11, according to CoinGecko data provided for this analysis, after rising roughly 2.4% over 24 hours.
The token had spent much of the previous week moving between approximately $8.10 and $8.35 before breaking above the upper part of that range during Monday’s session.
Price briefly approached $8.50 after the breakout, putting LINK at its highest level of the past seven days.
The latest move has taken its weekly gain to around 4.3%, while its 30-day performance stood at approximately 5.4%.
Standard Chartered’s call has arrived as Chainlink expands its presence in institutional tokenization projects.
The network has worked with financial companies and infrastructure providers including Swift, Euroclear, Mastercard, Fidelity International, UBS and ANZ.
Its work with the Depository Trust & Clearing Corporation has also involved tokenized assets and infrastructure designed to support collateral mobility around the clock.
Standard Chartered’s thesis therefore comes as Chainlink already has several institutional projects tied to the use case identified by the bank.
Another recent development involves BitGo and its Wrapped Bitcoin infrastructure.
BitGo selected Chainlink’s Cross-Chain Interoperability Protocol, or CCIP, for WBTC, adding a multibillion-dollar crypto asset to the applications using Chainlink’s cross-chain technology.
LINK exchange supply falls as large holders withdraw tokens
On-chain activity has added another factor to LINK’s recent price move, with a sizeable amount of the token leaving centralized exchanges.
Santiment data cited by market reports showed approximately 1.26 million LINK flowed out of centralized exchanges on August 5.
The withdrawal represented the largest single-day net exchange outflow since June 29.
Exchange withdrawals can reduce the amount of LINK immediately available for trading, although they do not establish whether the holders intend to keep the tokens over a longer period.
The August 5 movement followed another large withdrawal in late July. A whale reportedly removed 1.58 million LINK, worth about $13.3 million at the time, from Binance.
As such, millions of LINK have moved away from centralized trading venues over the past several weeks while the token has remained close to the lower end of its 2026 trading range.
The technical picture, however, shows that the current rally needs additional momentum before it can be treated as a strong trend.
LINK price analysis
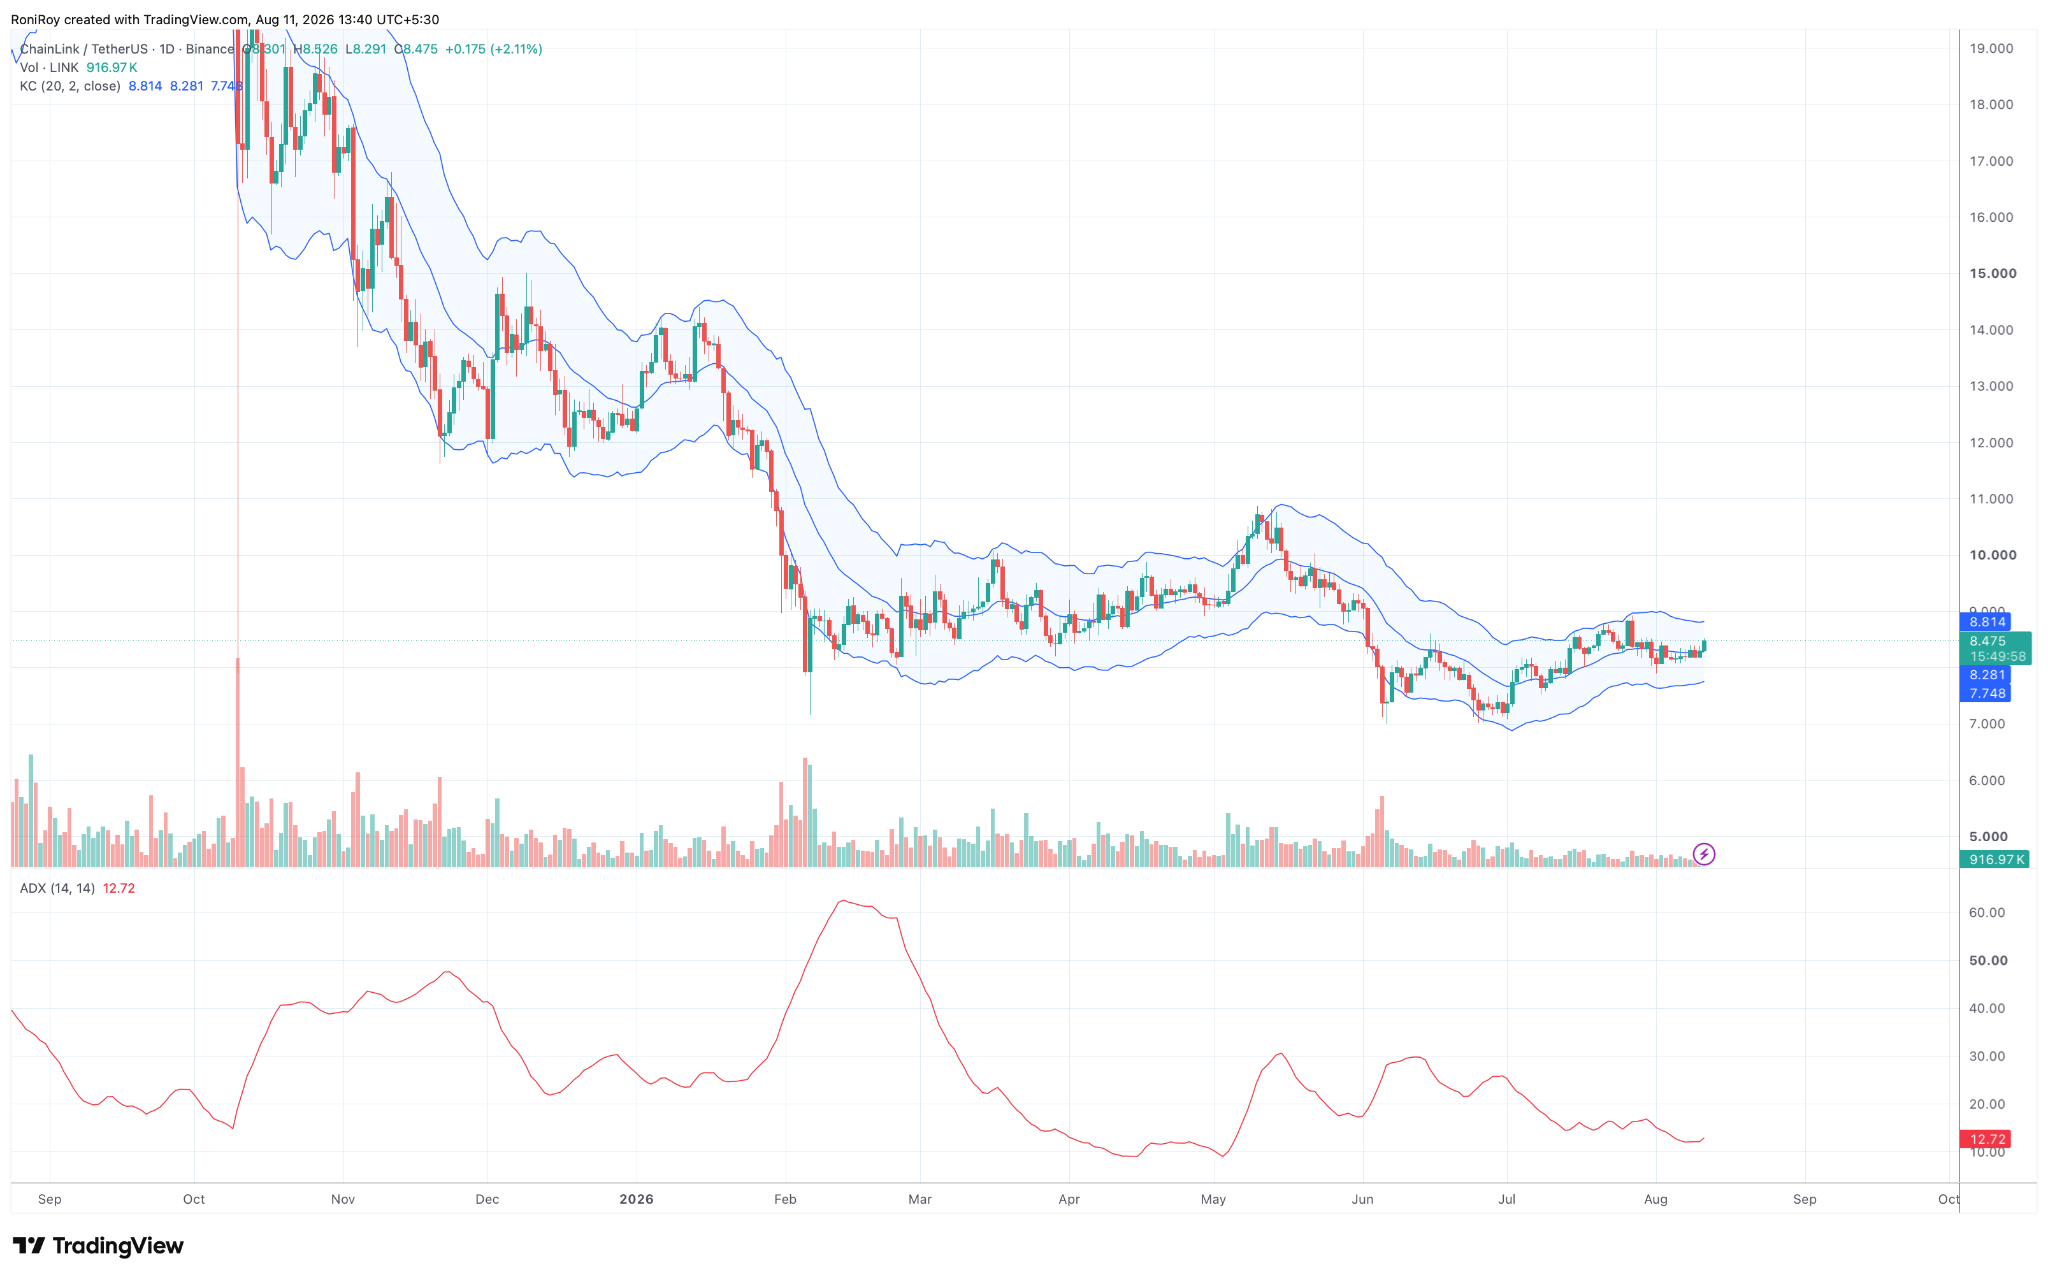
On the daily LINK/USDT chart, Chainlink traded near $8.48 on August 11 after recovering from a July low around $7.00.

LINK/USDT 1-day price chart. Source: TradingView.
The rebound has produced a series of higher lows, but LINK remains far below the levels around $10.50-$11 reached in May and substantially below its late-2025 prices.
The Keltner Channel places the daily middle line near $8.28, with the upper band around $8.81 and the lower band near $7.75.
LINK’s price near $8.48 has moved above the channel midpoint but has not yet reached the upper boundary.
A continued move above the Keltner midpoint would keep $8.80-$8.85 as the first technical area to watch.
A daily close above the upper channel could open a test of the psychological $9.00 level, followed by the previous May-June trading area around $9.50-$10.00.
Momentum on the daily timeframe remains considerably weaker than the latest price increase might imply.
The Average Directional Index, or ADX, stood at only 12.72. ADX measures trend strength rather than direction, and readings below 20 are commonly associated with weak or range-bound conditions.
LINK’s 12.72 reading therefore shows that the daily move has not yet developed into a strong directional trend despite the recovery from July.
For a more convincing breakout, traders would likely want to see price continue advancing while ADX begins climbing toward and eventually above the 20-25 area.
If price rises without a corresponding improvement in ADX, LINK could remain vulnerable to another period of consolidation around its current range.
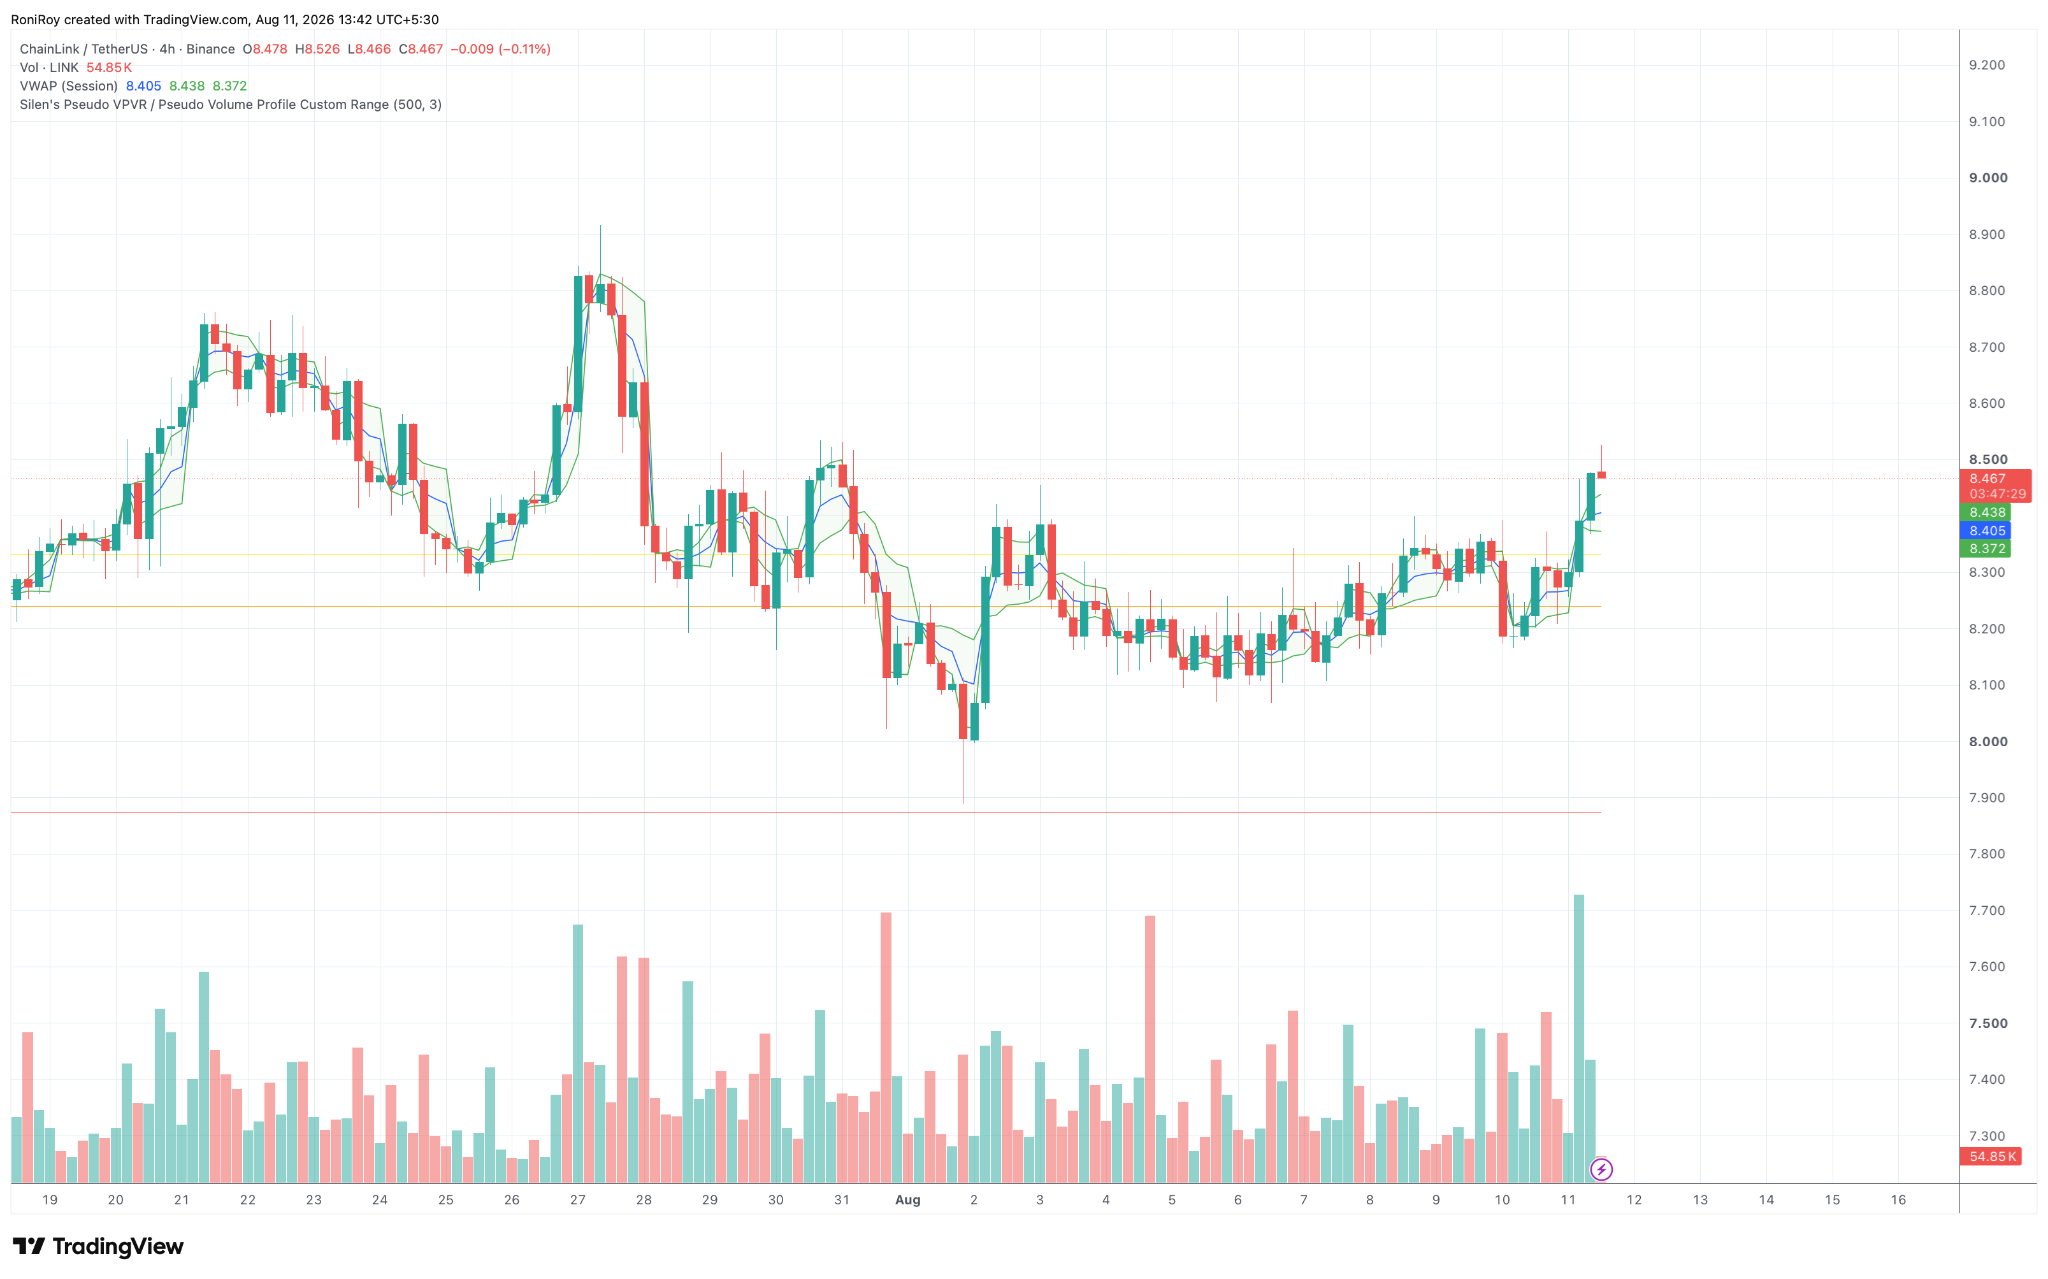
On the 4-hour chart, LINK has broken above a cluster of recent trading levels around $8.30-$8.35, with the latest 4-hour candles reaching approximately $8.50.
See below:

LINK/USDT 4-hour price chart. Source: TradingView.
The breakout was accompanied by a noticeable increase in trading volume, with one of the strongest green volume bars on the displayed chart occurring during the August 11 advance.
VWAP levels on the 4-hour chart sit around $8.41, $8.44 and $8.37, depending on the displayed bands. With LINK trading near $8.47, price is currently above the main VWAP area.
Holding above roughly $8.37-$8.44 would therefore preserve the structure created by the latest breakout.
A pullback into that zone followed by renewed buying would also provide evidence that the former resistance area is starting to function as short-term support.
Meanwhile, LINK’s VPVR shows substantial trading activity concentrated around the $8.20-$8.35 region, where LINK spent much of early August consolidating.
Because a large amount of trading took place around that zone, $8.20-$8.35 could become the more important support area if LINK loses VWAP.
Below it, the chart shows another major support level around $7.85-$7.90, close to the lower boundary drawn on the 4-hour setup.
On the upside, the immediate obstacle sits around $8.50-$8.55, where the current rally has reached its first local resistance.
Clearing that area would put the daily Keltner upper band around $8.81 within reach.
A sustained move through $8.81 would expose $9.00, while the daily chart places the next substantial historical resistance around $9.50-$10.00.
LINK traded repeatedly in that region between March and May before losing support during the June decline.
The stronger bullish scenario would require LINK to reclaim $10 and then challenge the May swing high around $10.70-$10.80.
Such a move would represent a much larger technical recovery than the current August 11 breakout and would likely require the daily ADX to rise materially from its current 12.72 reading.
Conversely, failure to hold the 4-hour VWAP cluster around $8.37-$8.44 could return LINK toward $8.20-$8.30, where the volume profile shows heavier previous trading.
The daily Keltner lower band near $7.75 would become relevant if selling pushes LINK through that support area, while the 4-hour chart places another visible floor close to $7.87.
For now, the 4-hour chart shows LINK trading above VWAP after a volume-backed breakout, while the daily Keltner setup leaves room toward roughly $8.81.
The daily ADX at 12.72 remains the main technical constraint, with the indicator yet to confirm that LINK’s recovery has developed the trend strength needed for a sustained move through the higher resistance levels.
The post LINK price forecast: is $9 next after Standard Chartered’s $200 call? appeared first on Invezz