





Bitcoin BTC has risen roughly 1% over the past 24 hours to trade near $79,000 on Sept. 4, but has surrendered an earlier move above $81,000 after stronger US employment data revived expectations of another Federal Reserve rate hike.
Bitcoin’s reversal followed the August US payrolls report, which showed the economy added 162,000 jobs, almost three times the 56,000 economists had expected.
The unemployment rate held at 4.1%, while average hourly earnings rose 0.3% from July and 3.1% from a year earlier. July payrolls were revised from a 23,000 decline to a 21,000 increase.
BTC had climbed from below $78,000 on Sept. 3 and briefly traded near $82,000 on Friday before dropping back below $80,000.
The reversal has left Bitcoin once again struggling to hold above $80,000, while its seven-day performance remains roughly flat.
The move above $80,000 initially followed comments from Federal Reserve Governor Christopher Waller, who indicated he could support keeping interest rates unchanged at the September meeting if incoming inflation figures continued to improve.
Expectations for the Fed to leave rates unchanged rose following his remarks, helping Bitcoin and other risk assets recover.
Demand from US spot Bitcoin exchange-traded funds provided a separate source of buying.
The funds recorded $731 million in net inflows on Sept. 3, their largest daily intake since January, according to SoSoValue data cited by crypto.news. BlackRock’s IBIT accounted for $454 million of the total.
Friday’s employment figures then reversed part of the macro trade that had helped BTC cross $80,000.
The probability of a September Fed rate hike climbed to 62% following the payroll release, as stronger hiring gave policymakers more room to keep monetary policy restrictive.
Bitcoin’s inability to hold $80,000 therefore comes as ETF demand and expectations for US monetary policy pull the market in opposite directions.
Spot ETF buying helped BTC break the level, while the payroll surprise brought interest-rate risk back into focus before the Fed’s Sept. 15–16 meeting.
The next major US inflation reading is due on Sept. 11. Waller had tied his support for holding rates steady to continued progress on inflation, leaving the consumer price index particularly important after Friday’s stronger labour figures.
Inflation remains a key consideration for the Fed despite the stronger employment report.
Crypto regulation could provide a separate catalyst four days later, with a procedural Senate vote on the CLARITY Act expected on Sept. 15.
The Federal Reserve’s policy decision follows on Sept. 16, when investors will be watching both the rate decision and Chair Kevin Warsh’s comments on inflation and employment.
ETF flows will remain relevant before both events. Several more days of strong inflows could help Bitcoin hold above $80,000, while fresh outflows could make another breakout harder.
BTC price analysis
Bitcoin’s daily chart shows the price near $79,000 after reaching an intraday high above $81,400 and falling back below $80,000.
The rejection has not yet reversed the larger breakout from the $63,000–$65,000 area in August, but buyers have so far failed to establish $80,000 as support.
All three major simple moving averages remain well below the current price. The 50-day SMA stands near $68,759, the 100-day SMA near $66,330, and the 200-day SMA around $69,621.

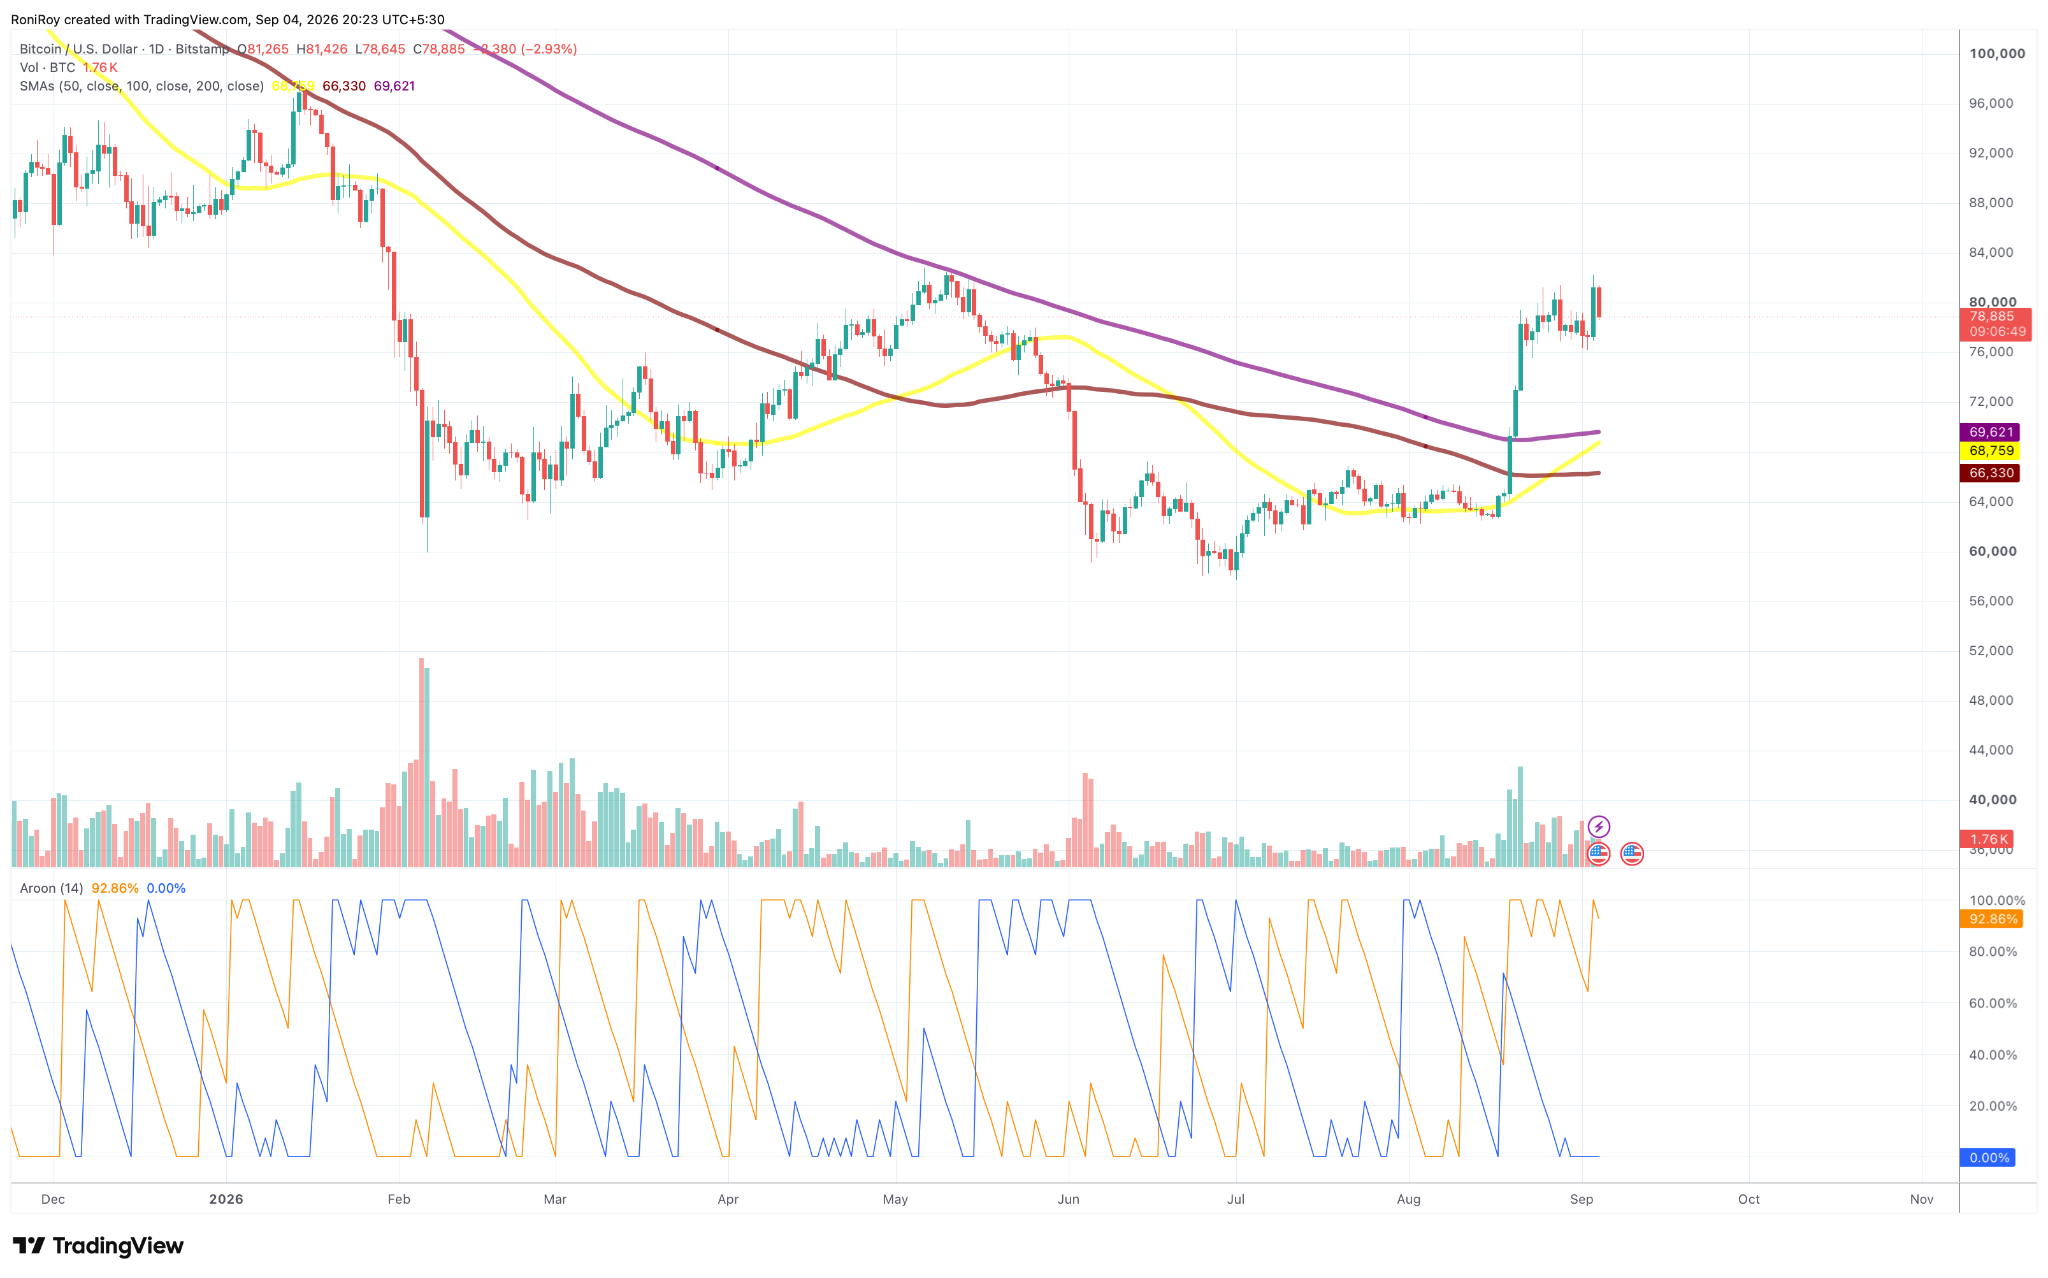
BTC’s position roughly 13% above the highest of those averages leaves the daily trend positive, although it also creates considerable room for a pullback without breaking the larger structure.
Aroon gives a similarly strong trend reading. Aroon Up is at 92.86%, while Aroon Down has fallen to 0%. With recent highs occurring much more recently than significant lows, the indicator continues to favour the uptrend despite Friday’s rejection.
Buying pressure has not disappeared either. Chaikin Money Flow is at 0.31, well above its zero line after rising sharply during the August breakout.
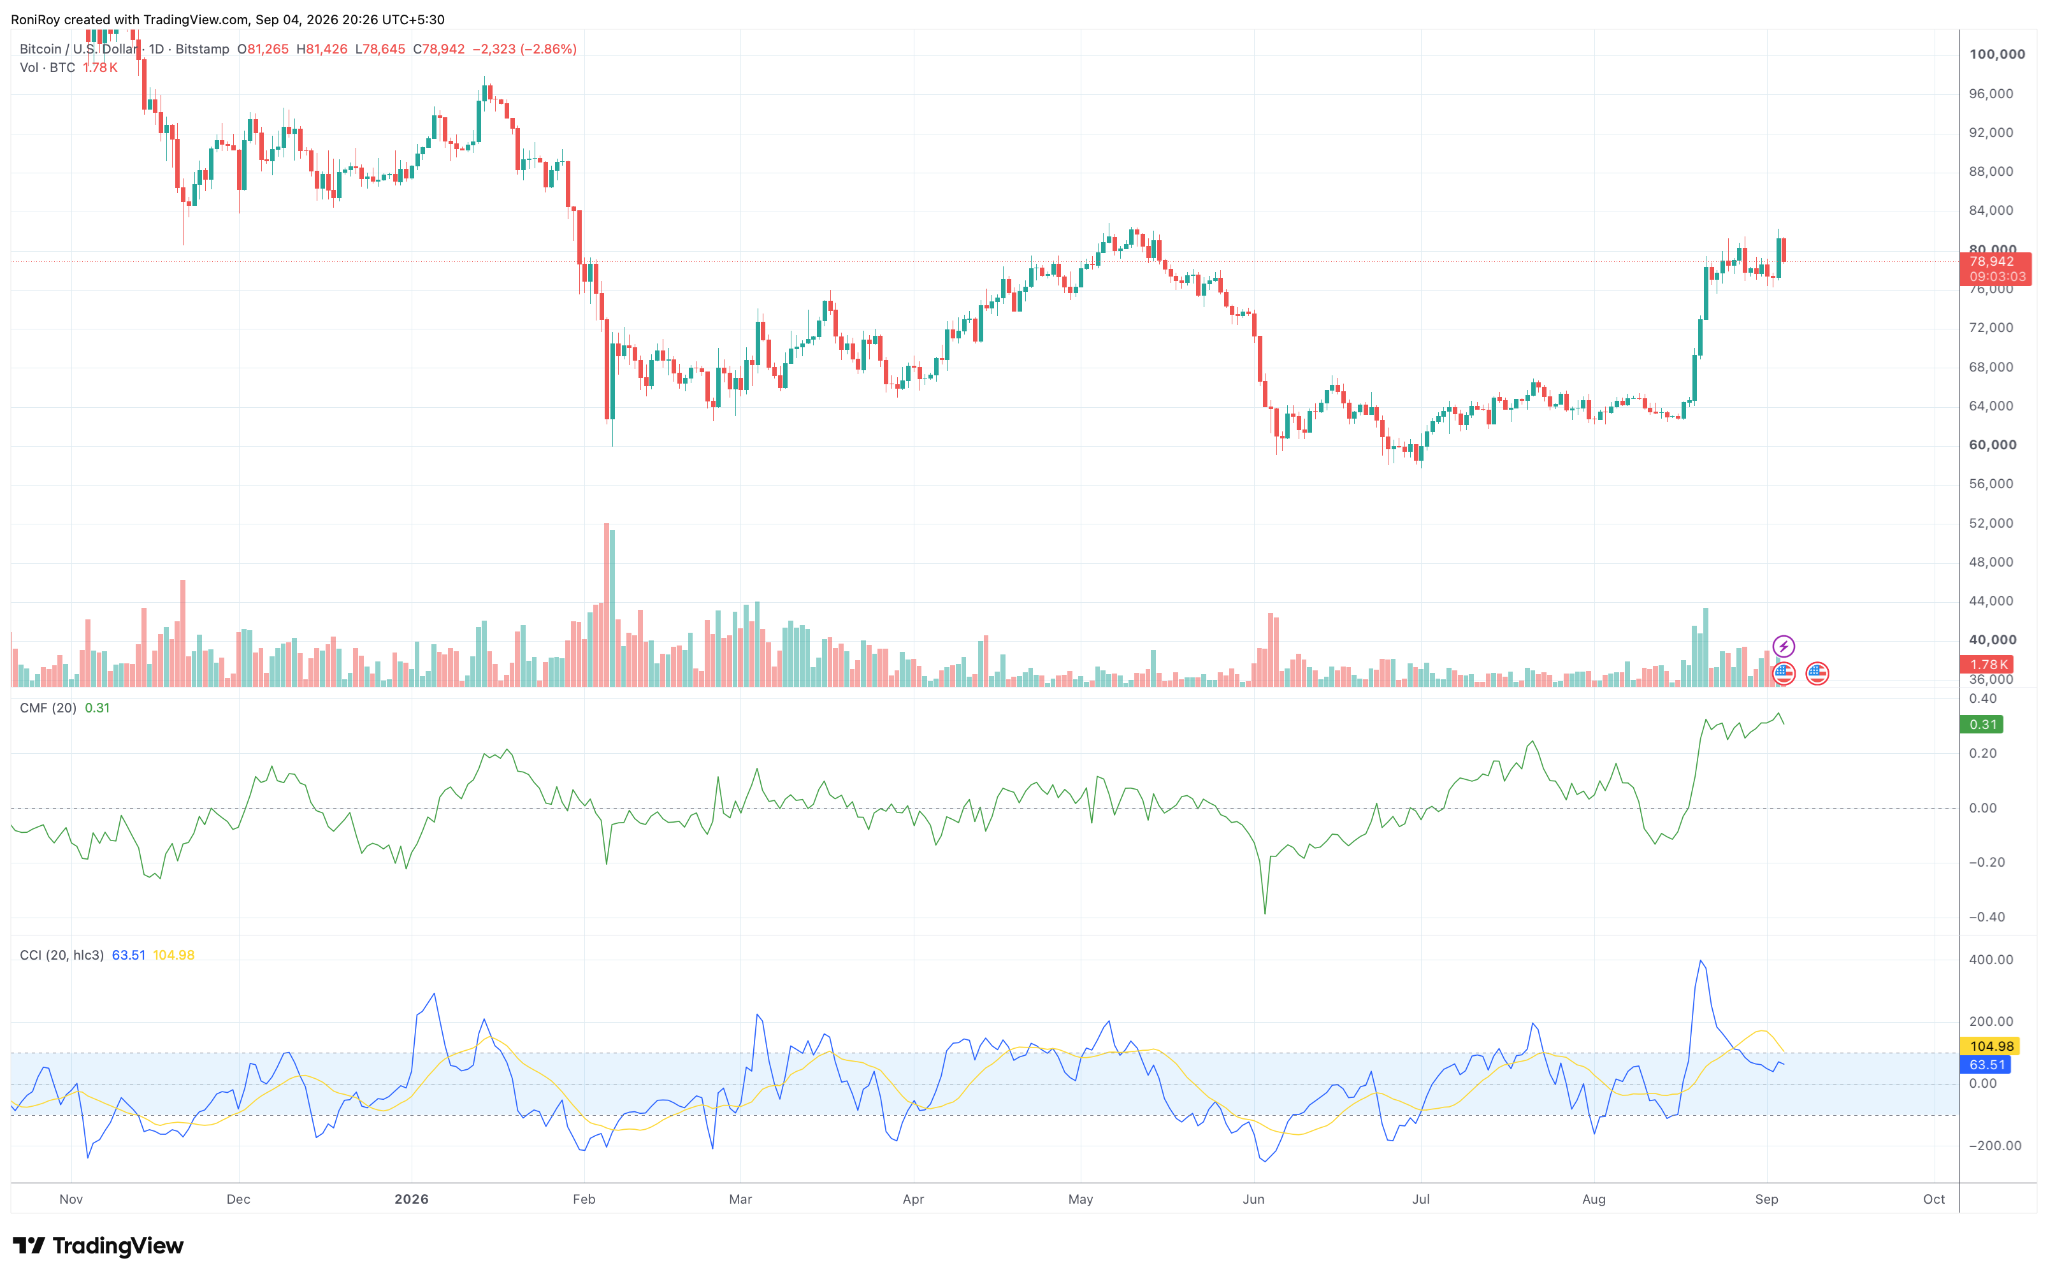
The reading means accumulation continues to outweigh distribution on the daily timeframe, which supports another attempt at $80,000 if BTC can hold the $78,000–$79,000 region.
Momentum has cooled more noticeably. The Commodity Channel Index has dropped to 63.51 after briefly moving above 300 during the initial breakout, while its signal average remains higher at 104.98.
CCI staying above zero keeps momentum positive, but the fall from its recent extreme fits the loss of momentum seen as BTC was rejected near $82,000.
A daily close back above $80,000 would put $81,400–$82,000 back in focus.
Clearing that zone would leave little recent chart resistance immediately overhead, with $84,000 becoming the next probable target.
Failure to hold the current area would put $78,000 first in view.
The 48-hour Binance BTC/USDT liquidation heatmap shows leverage clustered around $78,000–$78,700, while a larger pocket sits between roughly $76,000 and $77,000.

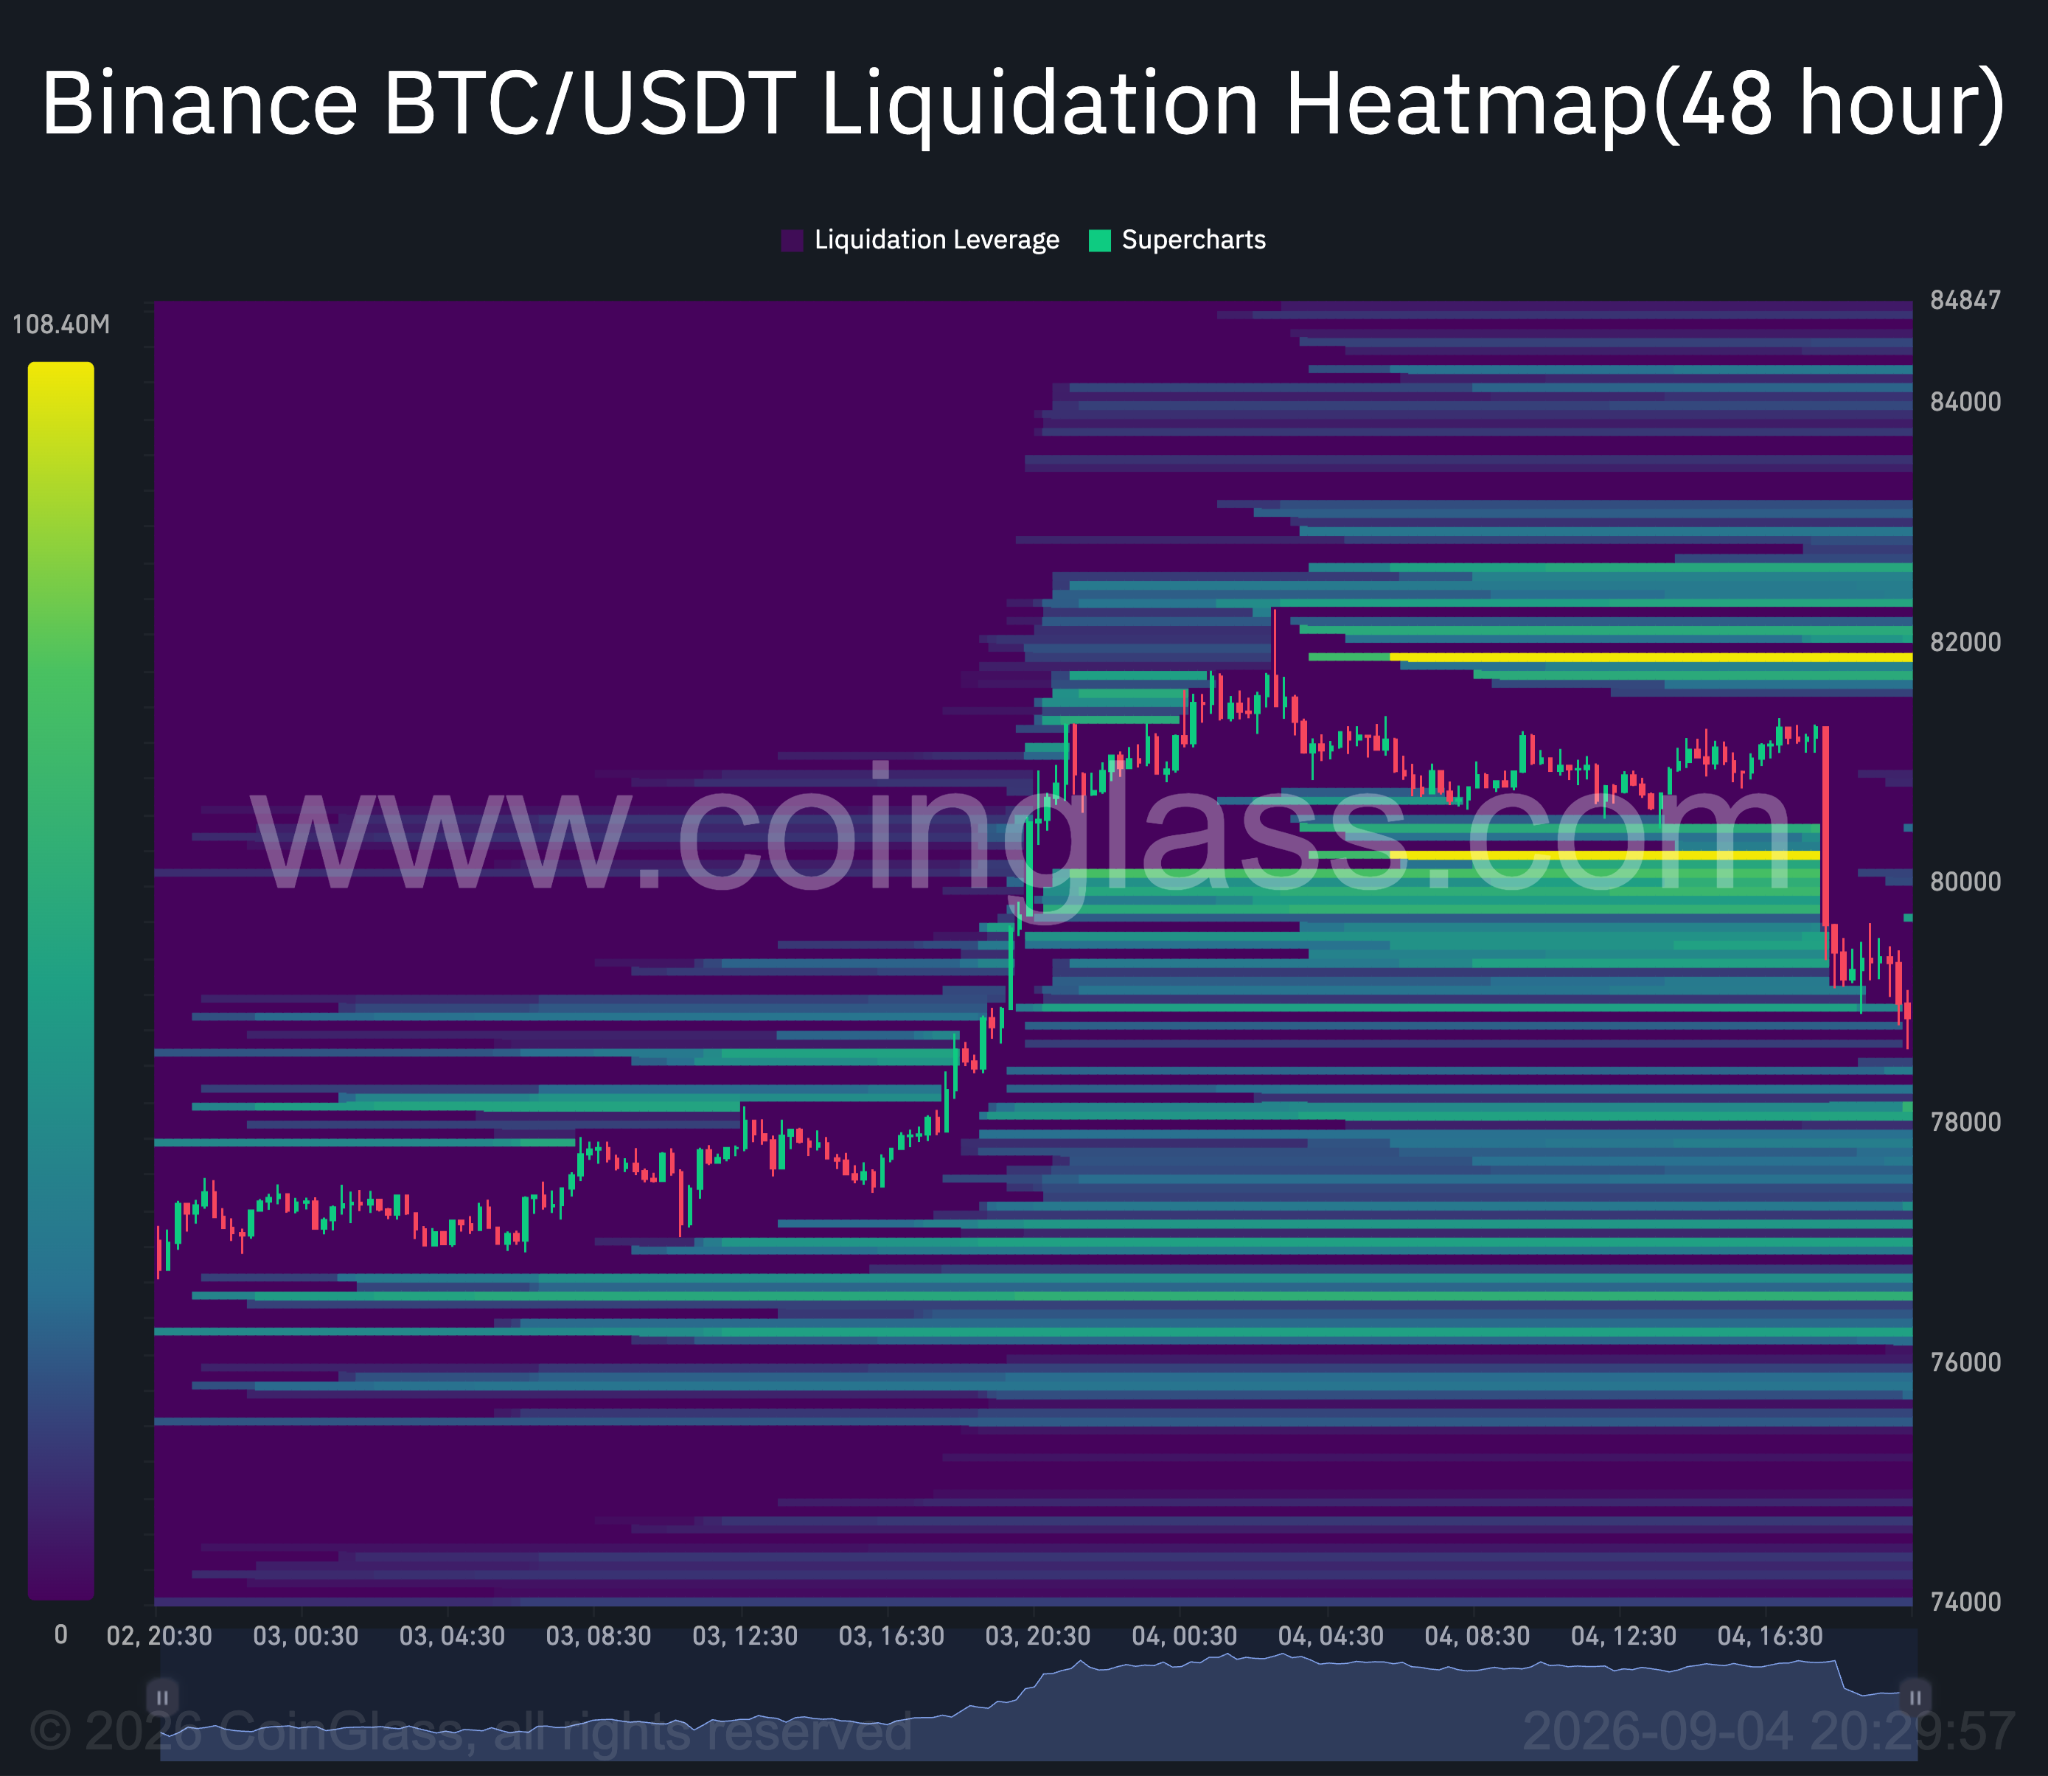
These concentrations could draw price lower if selling continues.
Liquidity remains substantial on the other side as well. The largest nearby concentration above BTC sits around $81,700–$82,300, overlapping Friday’s price high.
A recovery through $80,000 could therefore push BTC towards that zone as short liquidations accelerate, while a break below $78,000 would increase the probability of a move towards $76,000–$77,000.
The post Why is Bitcoin price struggling around $80,000? appeared first on Invezz